
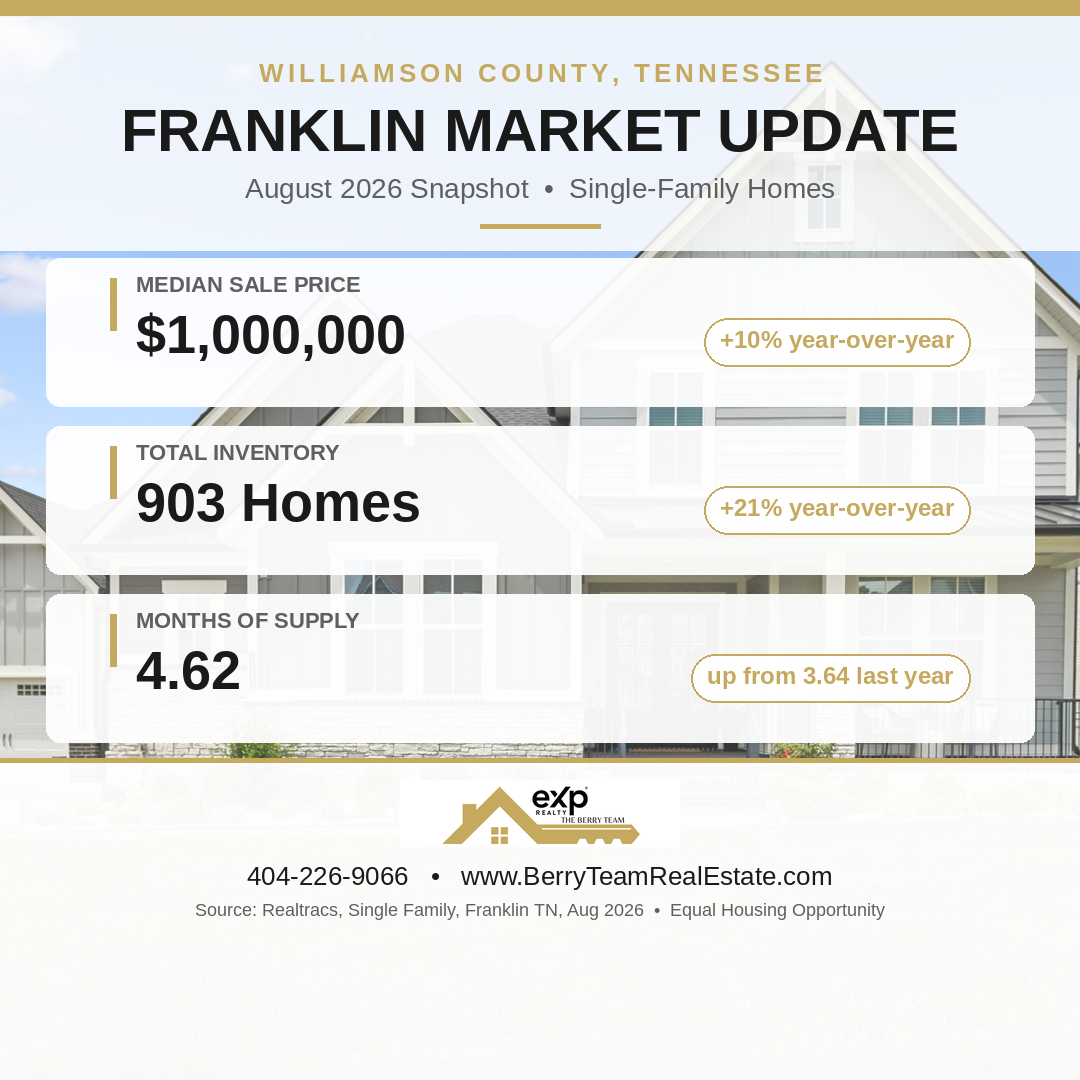
Franklin TN home prices crossed a notable milestone in August 2026: the median sale price for single-family homes hit $1,000,000, up 10% from August 2025, according to Realtracs MLS data. But the headline price isn’t the only story — inventory is climbing, homes are staying on the market longer before going under contract, and the balance of power between buyers and sellers is shifting in ways worth understanding whether you’re buying or selling in Franklin this fall.
Here’s what the numbers actually show, straight from the source.
Franklin TN Home Prices in August 2026: What the Realtracs Data Shows
Per Realtracs’ single-family home report for Franklin, TN, the median sale price reached $1,000,000 in August 2026, up from $907,500 a year earlier — a 10% year-over-year increase. The average sale price moved much less, up just 1% to $1,207,501, which tells us the middle of the market strengthened more than the very top end.
Meanwhile, the average list price on active listings actually dipped slightly, down 1% to $2,036,400 — a reminder that “active” list prices (often skewed by a handful of high-end luxury listings still sitting on the market) don’t always move in the same direction as what homes are actually closing for.
Inventory and Months of Supply: A Shifting Market in Williamson County
The clearest signal in this month’s data is inventory. Total inventory in Franklin was up 21% year-over-year (903 homes vs. 746 in August 2025), and average active inventory rose 19% to 598 homes. Months of supply — a key gauge of market balance — climbed 27%, from 3.64 months to 4.62 months.
That’s still below the 6-month mark that traditionally defines a balanced market, so Franklin remains tilted toward sellers overall. But at 4.62 months of supply, it’s noticeably less lopsided than it was a year ago, and buyers have meaningfully more homes to choose from than they did last August. New listings were actually down slightly (245 vs. 257, a 5% dip), so the inventory growth is coming more from homes taking longer to sell than from a flood of new sellers.
That trend shows up across Williamson County more broadly too, with buyers in nearby Nashville, Spring Hill, Columbia, and Lewisburg likely seeing similar breathing room as fall approaches.
How Long Homes Are Taking to Sell in Franklin, TN
The timing metrics tell an interesting, slightly mixed story. Homes that closed in August 2026 had spent an average of just 25 days on market before going under contract — down 26% from 33 days the year before. But the average time from list to contract across the broader active/pending pool rose to 68 days, up 21% from 56 days last year.
Put together, this likely reflects a market with two speeds: well-priced, well-presented homes are still moving quickly (that 25-day figure), while a growing share of listings are sitting longer and pulling the broader averages up. Once a home does go under contract, the closing process itself has stayed steady — contract-to-close averaged 39 days, almost identical to last year’s 38 — and total list-to-close time actually ticked down slightly to 88 days.
Closings themselves were down 8% year-over-year (155 vs. 168), even as homes going under contract rose 11% (166 vs. 149) — a sign that August’s contract activity should translate into a healthy September and October closing pipeline for Franklin sellers.
What Rising Inventory Means for Buyers and Sellers in Franklin and Williamson County
For buyers house-hunting in Franklin, this is welcome news: more inventory, more months of supply, and more time to make a decision than a year ago, even with prices still rising. It’s worth noting the median price crossing $1 million doesn’t mean every Franklin home costs seven figures — it reflects the mix of what’s selling, and there’s still real opportunity across price points, especially for buyers willing to negotiate on homes that have been listed a few weeks.
For sellers, the data is a nudge toward strategic pricing rather than a red flag. Demand is clearly still there — under-contract activity is up double digits — but with 21% more competing inventory than last year, homes priced to match current buyer expectations from day one are the ones landing in that faster 25-day pool, rather than drifting into the slower 68-day average.
Curious What This Means for Your Franklin or Williamson County Home?
Market data tells part of the story — your specific neighborhood, price point, and property type can look quite different from the county-wide averages. If you’re thinking about buying or selling in Franklin, Nashville, Spring Hill, Columbia, or Lewisburg, I’d be glad to walk through what these trends mean for your situation. Call or text me at 404-226-9066, or visit www.BerryTeamRealEstate.com — let’s find you a place to call home.
Doris Berry, The Berry Team at eXp Realty — serving Franklin and the greater Williamson, Davidson, Maury, and Marshall County communities.
Equal Housing Opportunity. Market data sourced from Realtracs, Inc. (Residential: Single Family, Franklin, TN, August 2026; report date 09/12/26). © 2026 Realtracs, Inc. Provided for general informational purposes and not a substitute for a personalized market analysis of your property.